
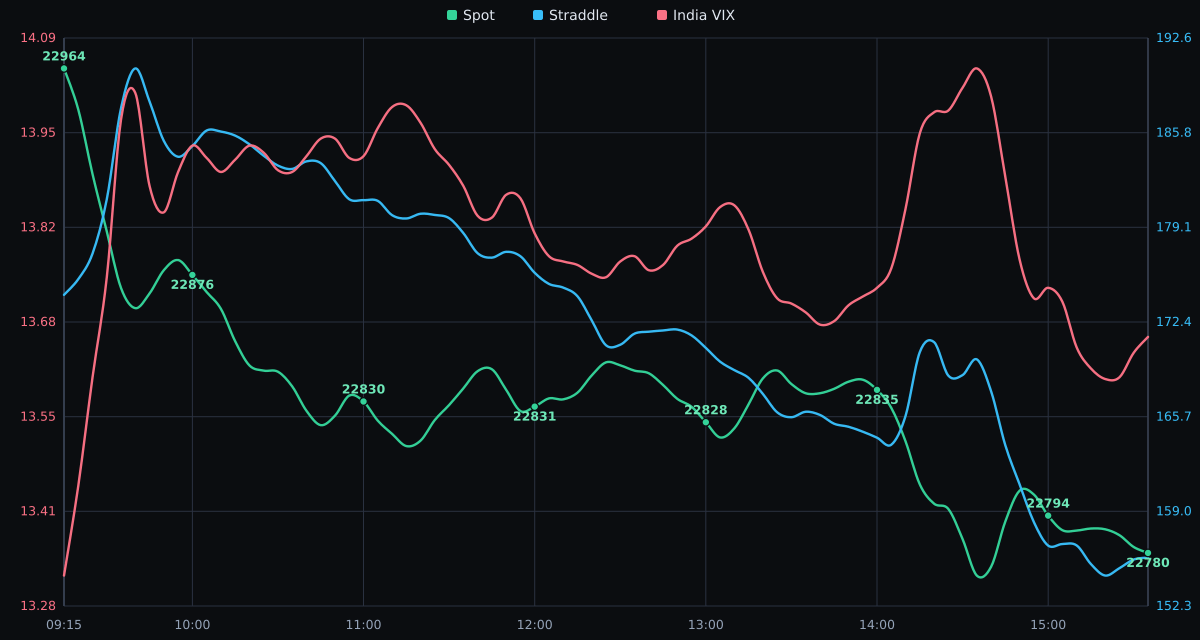
Prints are approximate. Use your broker for exact figures.
NIFTY closed at 22780.25, down 360.25 points from the previous close. The session high was 23080.25 and the low was 22762.20, so it closed near the low of the range.
India VIX last print was 13.64, up 1.48 from the previous close of 12.16. The ATM straddle moved from 169.1 to 155.95.
NIFTY 50 - Intraday Snapshot
| Metric | Status |
|---|---|
| Volatility | LOW |
| Micro Trend | BEARISH |
| Macro Trend | BEARISH |
| Momentum | STRONG |
NIFTY - PCR
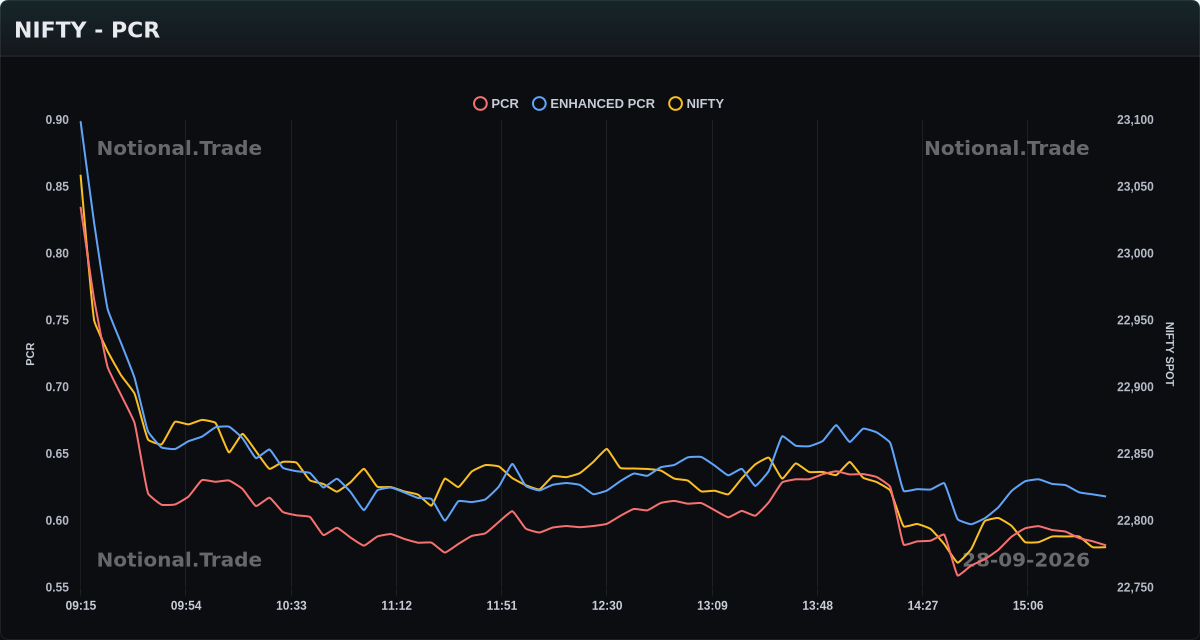
PCR opened at 0.83 and slipped through the session, reaching a low of 0.56 before closing at 0.58. Enhanced PCR followed a similar path, opening at 0.90, falling to 0.60, and ending at 0.62.
During the final hour, PCR eased from 0.59 to 0.58, a small move of -0.01. Enhanced PCR drifted from 0.63 to 0.62 over the same span, also -0.01.
NIFTY - OI Flow
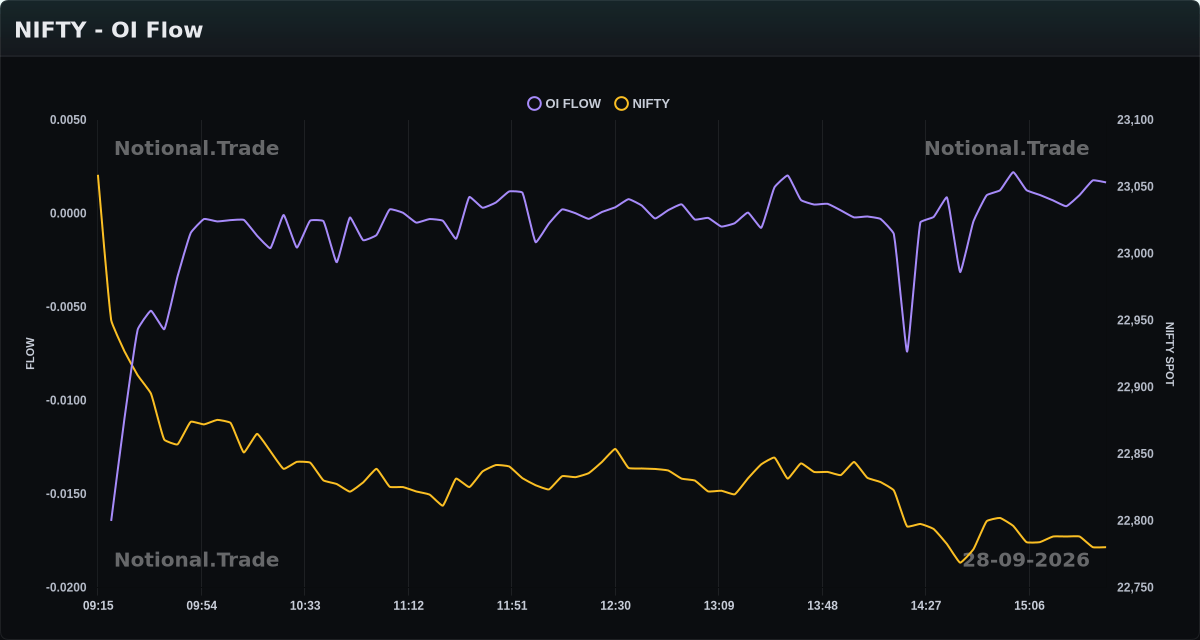
The OI Flow started the day at -0.0164, the lowest reading on the chart. From there it rose steadily, reaching a high of 0.0022 before settling to close at 0.0017. The line spent most of the session hovering near the flat zone after recovering from its weak open.
In the last hour, OI Flow moved from 0.0009 to 0.0017, a small rise of +0.0008.
NIFTY - Order Flow
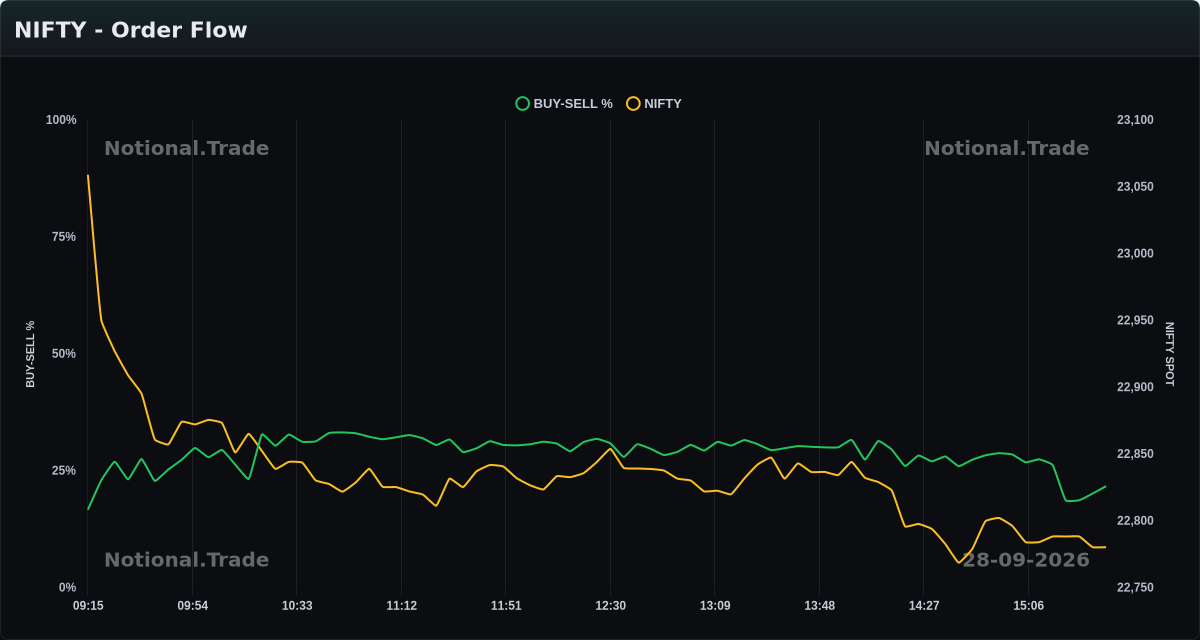
Buy-Sell % opened at 16.6% and reached a high of 33.2% before easing back. It ended the day at 21.7%, up from the start but well below the day’s peak. The low matched the open at 16.6%.
In the last hour, Buy-Sell % slipped from 28.1% to 21.7%, a fall of 6.4%.
Today’s Summary
NIFTY closed at 22780.25, down 360.25 points from yesterday’s close. The index opened near the day’s high of 23080.25 but drifted lower, settling in the lower part of the session range.
The session low of 22762.20 was the level that mattered, as the close finished just above it. India VIX rose 1.48 points to 13.64, and the ATM straddle narrowed from 169.10 to 155.95.
Live data: Market Dashboard. Earlier sessions: Market Analysis.
Disclaimer
This post is for informational purposes only. It is not investment advice. See our Privacy Policy (including disclaimer) for full terms.