
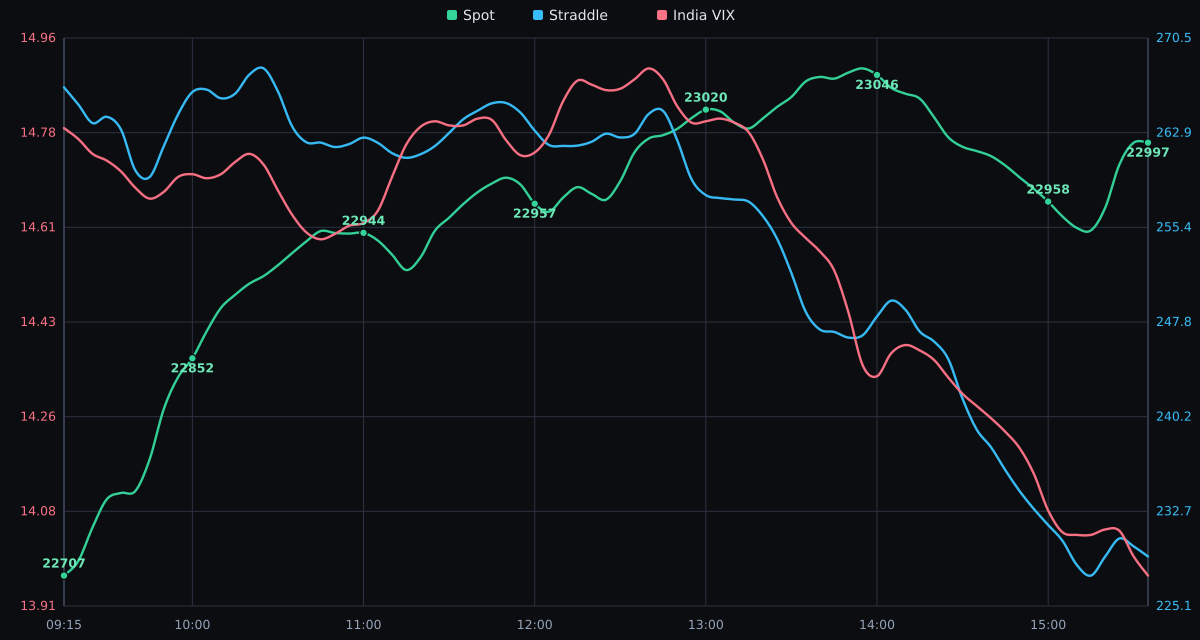
Prints are approximate. Use your broker for exact figures.
NIFTY closed at 22997.35, up 374.65 points from the previous close. The day ranged from a low of 22637.40 to a high of 23056.40, with the close sitting near the top of the range.
India VIX last print was 14.03, down 0.60 from the previous close of 14.63. The ATM straddle ended at 229.05, lower than the start of 272.15.
NIFTY 50 - Intraday Snapshot
| Metric | Status |
|---|---|
| Volatility | LOW |
| Micro Trend | BULLISH |
| Macro Trend | BULLISH |
| Momentum | STRONG |
NIFTY - PCR
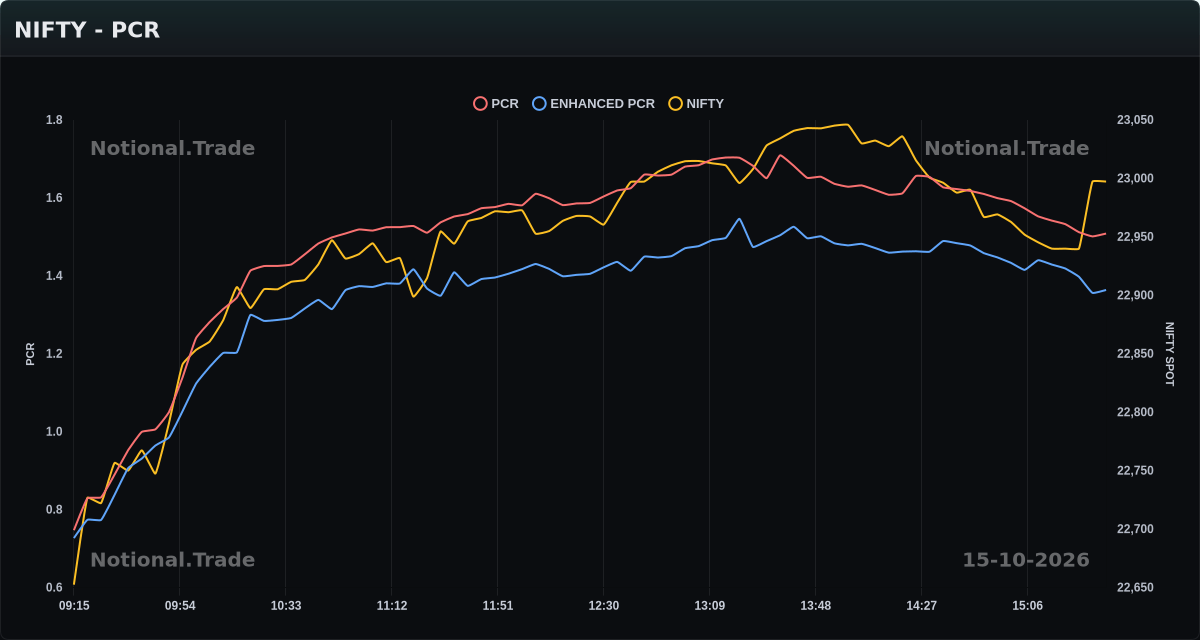
The PCR opened at 0.75 and rose through the day, reaching a high of 1.71 before closing at 1.51. The Enhanced PCR opened at 0.73, peaked at 1.55, and finished at 1.36. Both lines moved together, lifting from the open to a midday peak and easing back as the session closed.
In the last hour, the PCR slipped from 1.63 to 1.51, a drop of 0.12. The Enhanced PCR moved from 1.49 to 1.36, down 0.13.
NIFTY - OI Flow
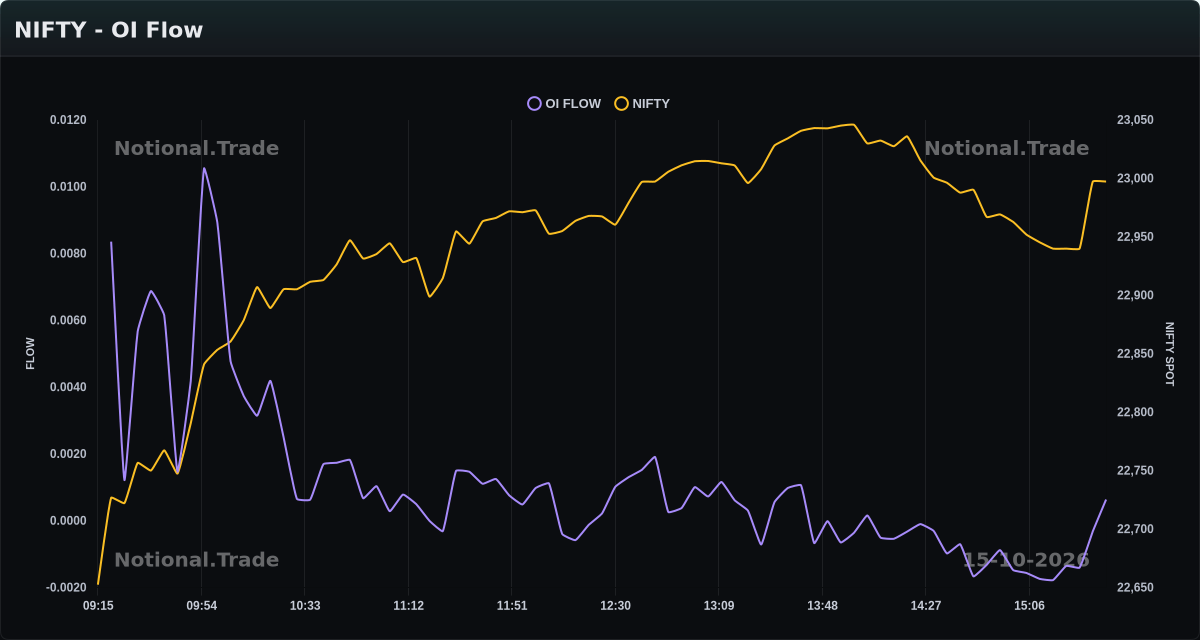
OI Flow started the day at 0.0084, climbed to a high of 0.0106, then drifted lower. It bottomed at -0.0018 before settling at 0.0006 by the close.
During the last hour, OI Flow rose from -0.0010 to 0.0006, a change of +0.0016, recovering from its weakest level of the session.
NIFTY - Order Flow
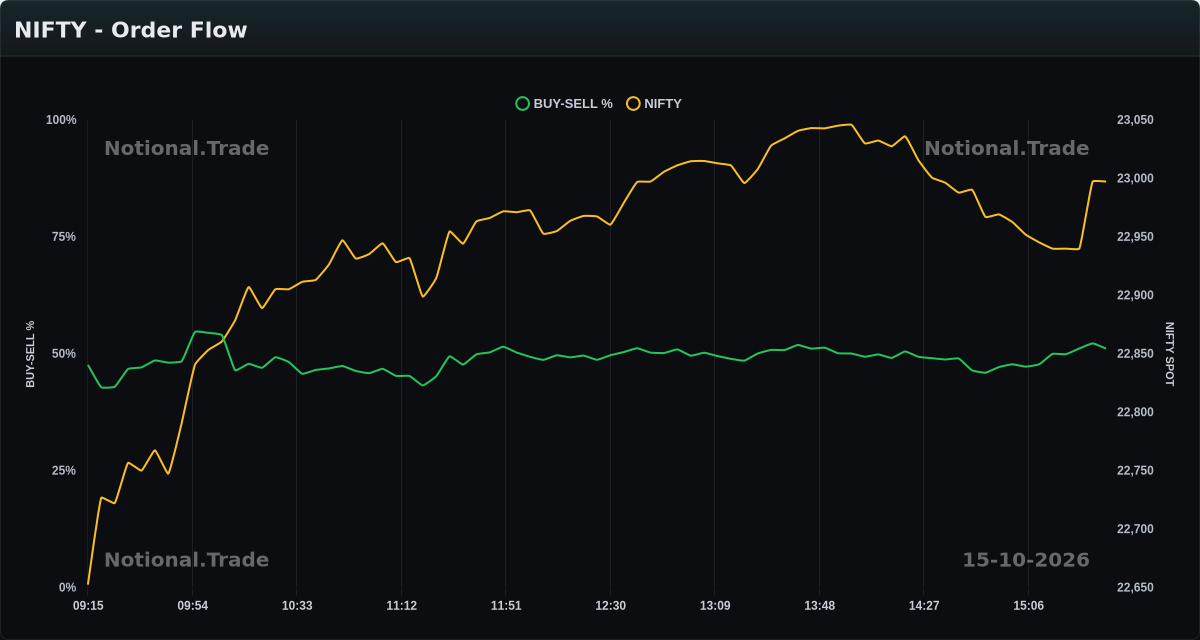
Buy-Sell % opened the session around 42.8% at the start, then climbed to a high of 54.7% during the morning. It later pulled back, and the day closed at 51.1%.
In the final hour, Buy-Sell % rose from 48.8% to 51.1%, a gain of +2.3%.
Today’s Summary
NIFTY closed at 22997.35, +374.65 points from the previous close. High 23056.40, low 22637.40. It opened at 22652.50 and finished in the upper part of the day’s range.
The day’s high was 23056.40. Price bounced from the 22637.40 low into the close. ATM straddle went from 272.15 to 229.05. India VIX moved from 14.63 to 14.03 (-0.60).
Live data: Market Dashboard. Earlier sessions: Market Analysis.
Disclaimer
This post is for informational purposes only. It is not investment advice. See our Privacy Policy (including disclaimer) for full terms.