Note: The numerical data appearing in this post might not be accurate but approximate due to latency and data processing delays. Please refer to your broker platform for precise figures.
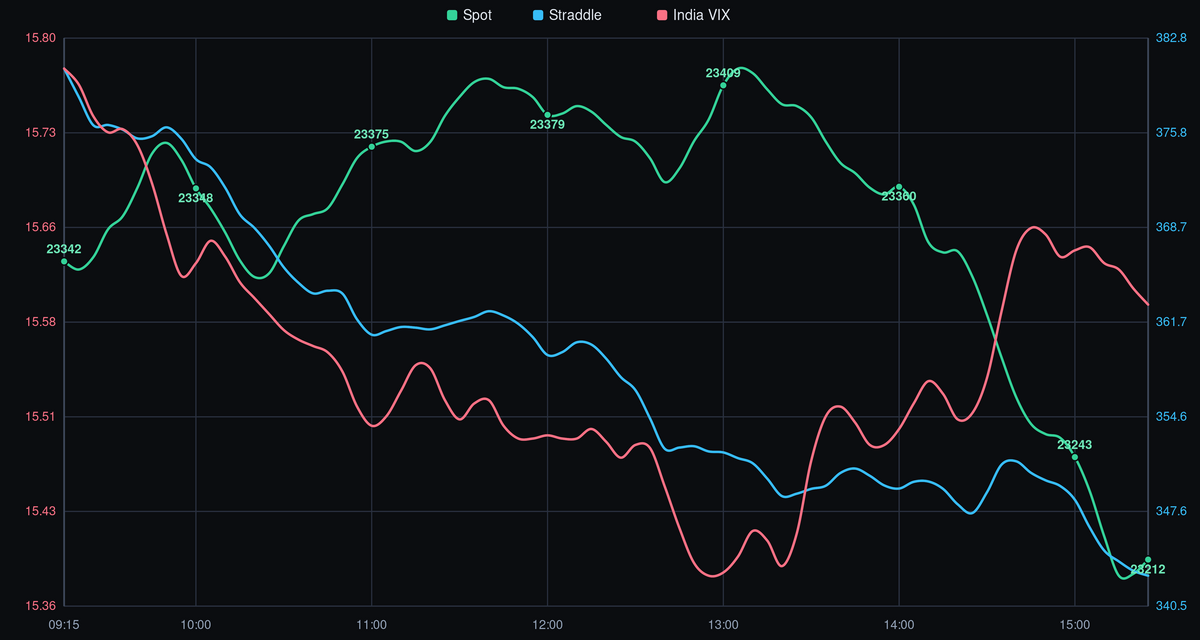
NIFTY closed at ~23214.95 (-27.15), session high 23425.35, session low 23184.60. VIX moved from 15.58 to ~15.63 (+0.05). Nifty’s Straddle Price shifted from 348 to 342.85.
NIFTY 50 - Intraday Snapshot
| Metric | Status |
|---|---|
| Volatility | LOW |
| Micro Trend | BEARISH |
| Momentum | WEAK |
NIFTY - PCR
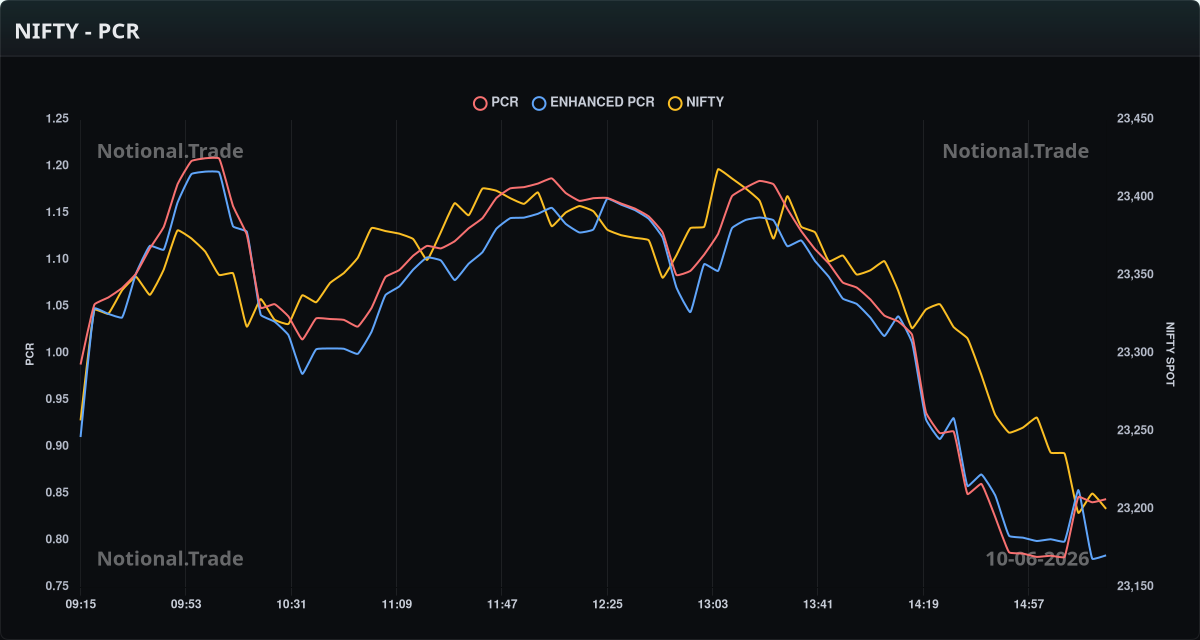
PCR opened at 0.99, reaching a high of 1.21 mid-morning and a low of 0.78 before close to end at 0.84. Enhanced PCR opened at 0.91, peaked at 1.19 mid-morning, and hit a low of 0.78 before close to finish at 0.78.
PCR moved from 0.79 to 0.84 for a change of +0.06, while Enhanced PCR moved from 0.80 to 0.78 for a change of -0.02 into the close. This movement is bearish.
NIFTY - OI Flow
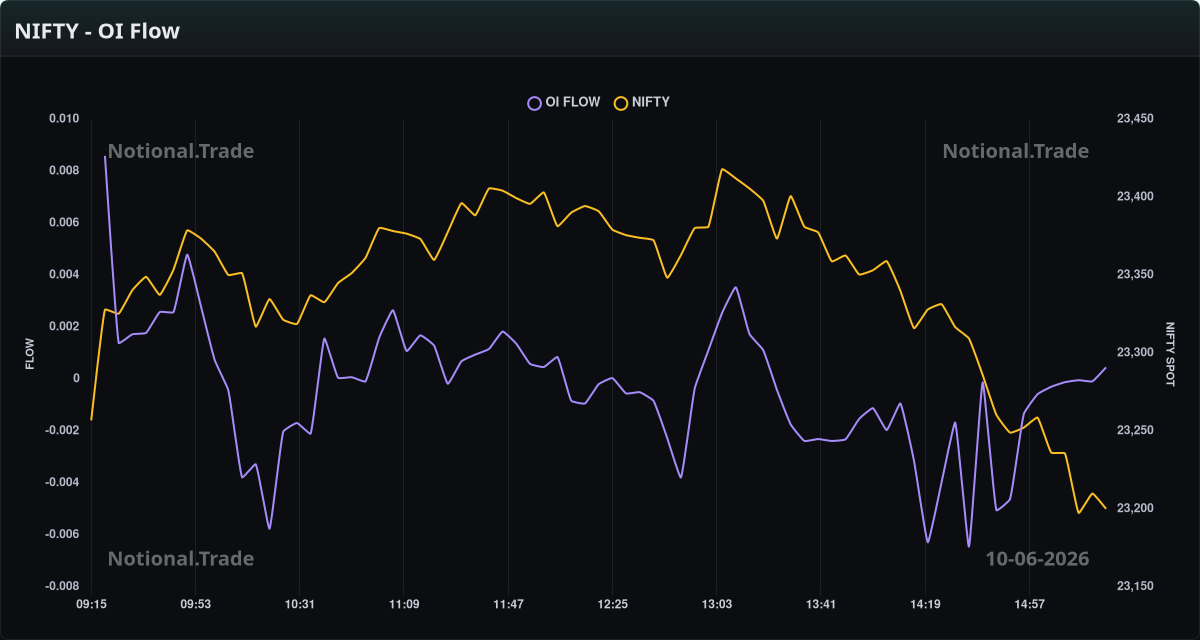
OI Flow opened at 0.01, which was the session high at market open. The indicator reached a low of -0.01 during the afternoon and closed at 0.00.
OI Flow moved from -0.00 to 0.00 into the close, a change of +0.00. This movement is bullish.
NIFTY - Order Flow
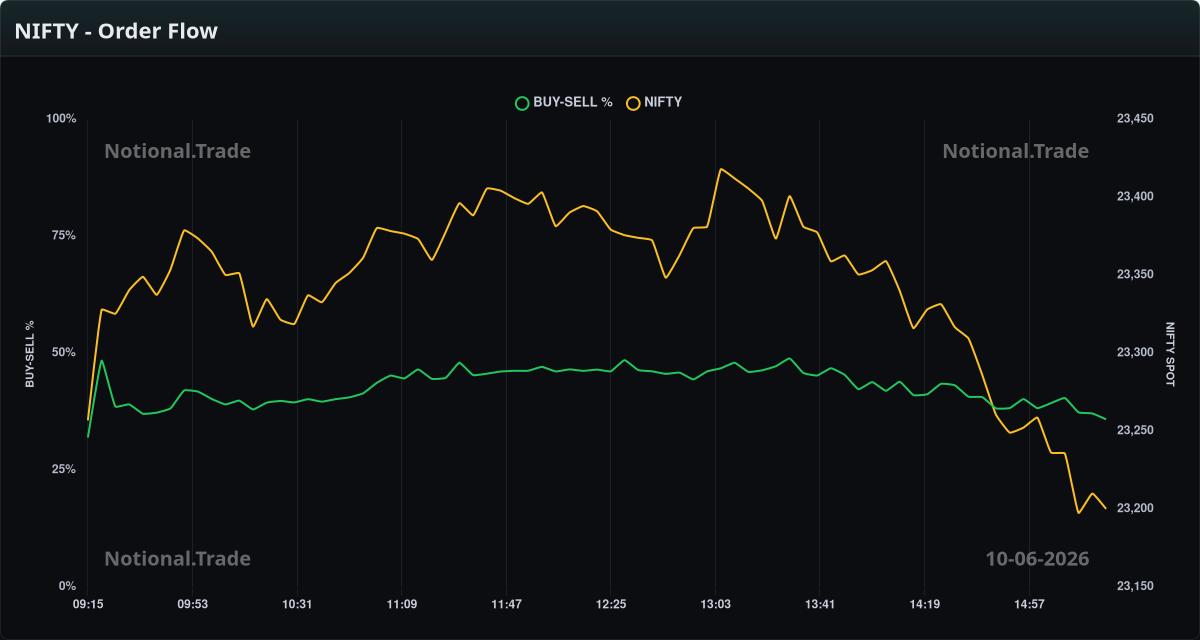
Buy-Sell % opened at 32.1% and reached a session low of 32.1% at market open. The indicator rose to a session high of 49.0% during the early afternoon before ending at 36.0%.
Buy-Sell % fell from 43.6% to 36.0% during the late session, a change of -7.6%. This movement into the close was bearish.
Today’s Summary
NIFTY opened at 23257.25 and reached a high of 23418.4. Price then reversed in a downward direction to a low of 23188.9 and closed lower at 23212.4. The net change for the session was -44.85 points.
The 23188.9 level is the support for tomorrow. The ATM Straddle moved from 347.85 to 342.85, while India VIX remained at 15.58.
VIX climbed to ~15.63.
For live data, visit our Market Dashboard. Previous analysis reports are archived at Market Analysis.
Disclaimer
This post is for informational purposes only. It is not investment advice. See our Privacy Policy (including disclaimer) for full terms.