
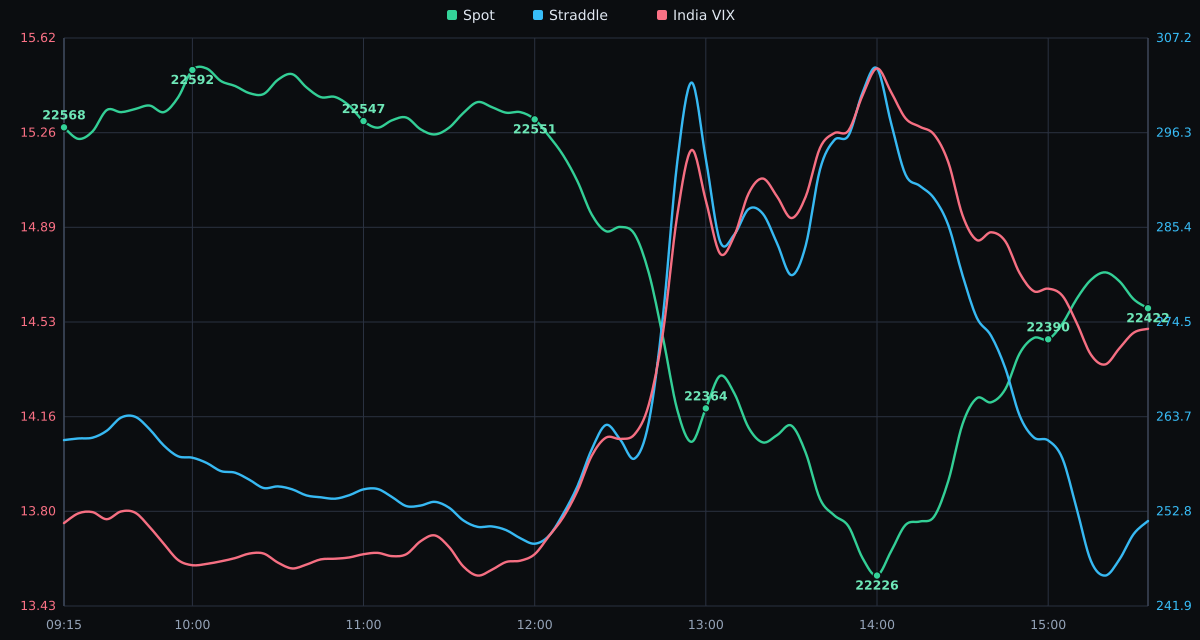
Prints are approximate. Use your broker for exact figures.
NIFTY closed at 22421.95, down 198.50 points from the previous close. The session high was 22610.60 and the low was 22217.30, so it closed near the low of the day.
India VIX last print was 14.46, up from a previous close of 13.49, a change of 0.97. The ATM straddle moved from 265.9 to 252.2.
NIFTY 50 - Intraday Snapshot
| Metric | Status |
|---|---|
| Volatility | HIGH |
| Micro Trend | BEARISH |
| Macro Trend | BEARISH |
| Momentum | WEAK |
NIFTY - PCR
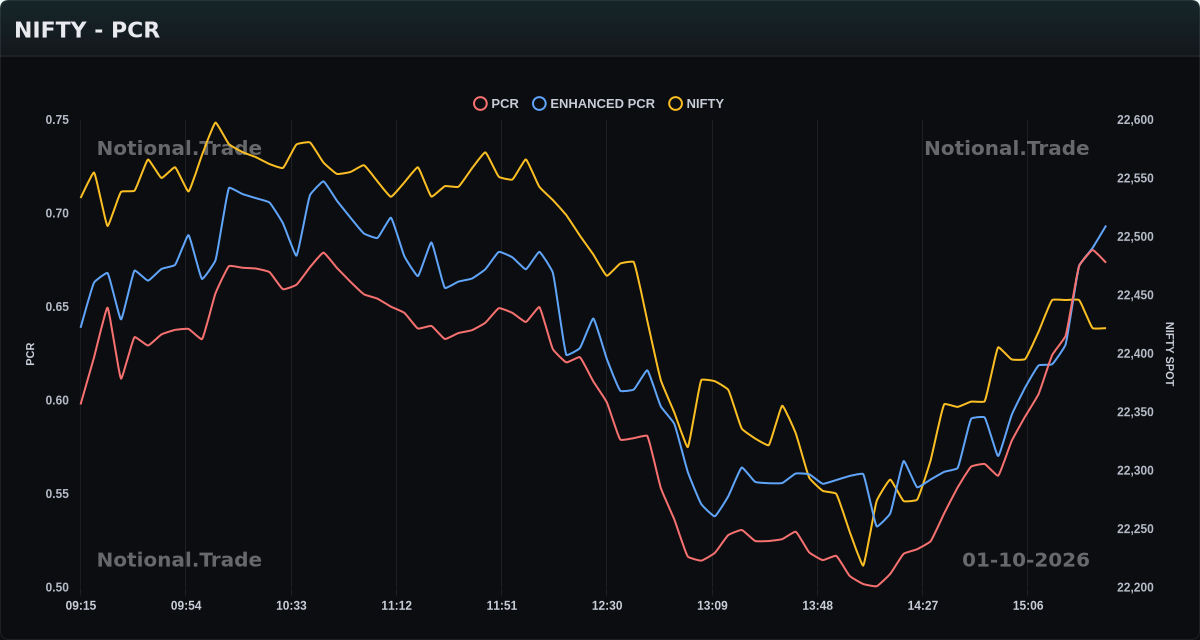
PCR opened at 0.60, slipped to a low of 0.50 in the afternoon, then recovered to close at 0.67. Enhanced PCR opened at 0.64, reached a high of 0.72, dropped to 0.53 in the afternoon, and finished at 0.69. Both lines moved together, bottoming out before climbing back.
Over the last hour, PCR rose from 0.54 to 0.67, a gain of 0.13. Enhanced PCR tracked it, moving from 0.56 to 0.69, also up 0.13.
NIFTY - OI Flow
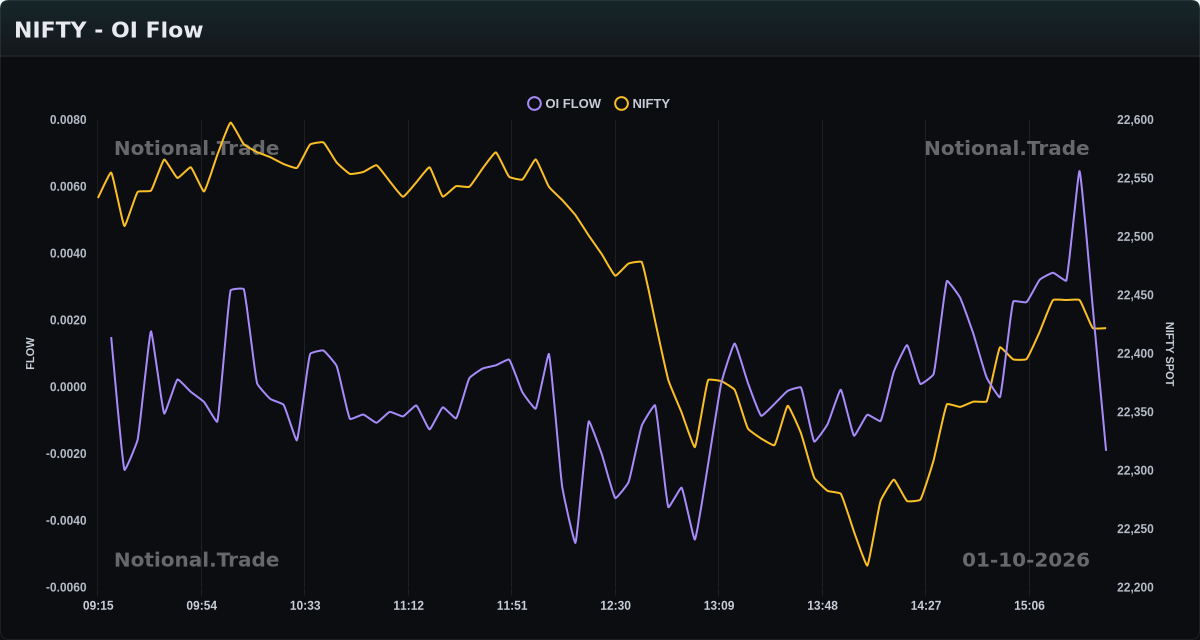
OI Flow opened at 0.0015 and rose to a high of 0.0065 before slipping to its lowest reading of -0.0047 during the session. It then closed at -0.0019, finishing the day lower than where it began.
Over the last hour, OI Flow fell from 0.0032 to -0.0019, a drop of -0.0051.
NIFTY - Order Flow
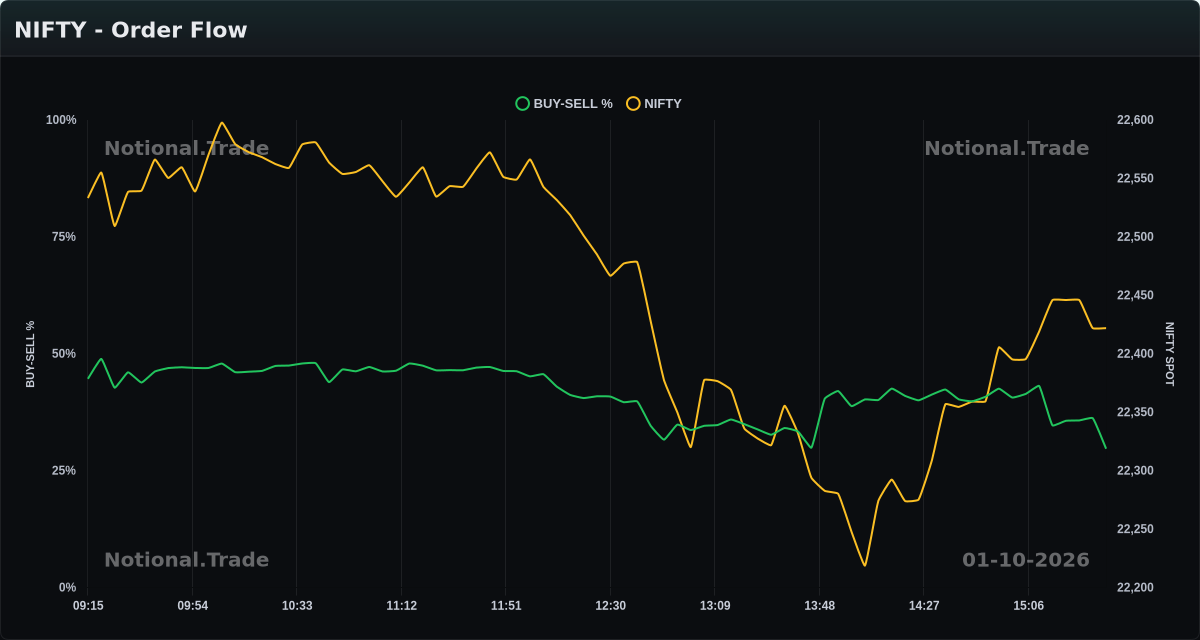
Buy-Sell % opened at 44.6% and rose to a high of 48.9% shortly after the open. It then drifted lower through the rest of the day, bottoming at 29.7% near the close.
Over the last hour, Buy-Sell % moved from 42.4% down to 29.7%, a drop of 12.7%. The decline was steady through the final session minutes.
Today’s Summary
NIFTY ended the day at 22421.95, down 198.50 points from the previous close. The index opened at 22533.25, slipped to a session low of 22217.30, then recovered to close near the middle of the day’s range. India VIX rose from 13.49 to 14.46, up 0.97 points.
The session high of 22610.60 was the upper end of the day’s range, while the low of 22217.30 marked the day’s lowest print. The ATM straddle eased from 265.90 to 252.20 over the session.
Live data: Market Dashboard. Earlier sessions: Market Analysis.
Disclaimer
This post is for informational purposes only. It is not investment advice. See our Privacy Policy (including disclaimer) for full terms.